Codiska at Ideon Science Park presents
Coding for No-Coders
10-Week Series of Hands-on Workshops for Driving Innovation in Your Field
Embark on a comprehensive learning journey designed to equip you with the coding skills required to excel in today’s data-driven world.
Embark on a comprehensive learning journey designed to equip you with the coding skills required to excel in today’s data-driven world.
No prior coding experience needed.
Goals
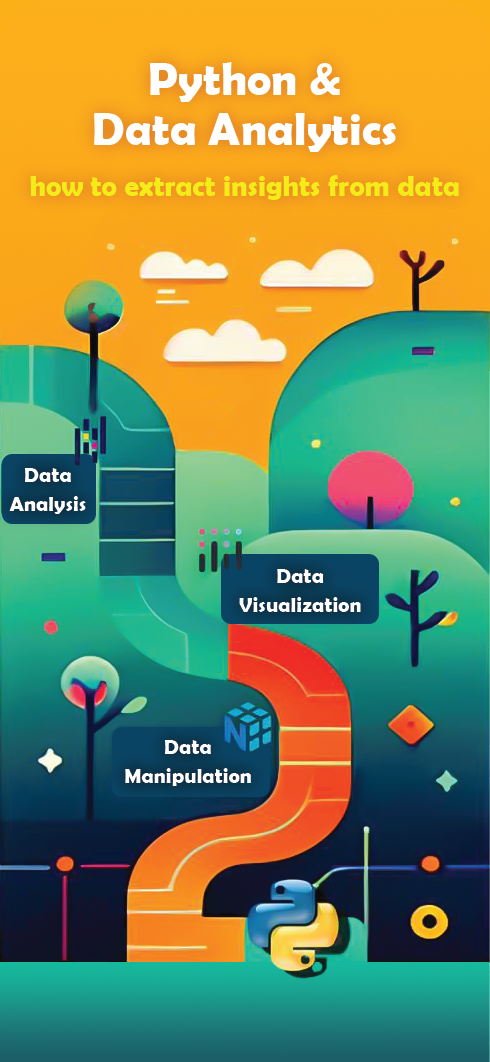
Learn how to program for data analytics; Extract, Cleans, Archive, Process and Visualize
Module 1: Fundamentals
- Environment Setup, Fast Development in Google Colab
- Fundamental Data Types
- Control Flow, Conditional Statements, Comprehension
Module 2: Fundamentals
- Functions in Python, Storing Function Libraries in Google Drive
- Working with Files
Module 3: Data Visualization
- Data Science with Python o Visualization – Matplotlib & Plotly
Module 4: Numerical manipulations
- Data Science with Python o Numerical Arrays – NumPy
Module 5: Data analysis
- Motivation for databases
- Data Science with Python o Data analysis with Pandas dataframes
Experimental Data Insights: Use Python to process and visualize large sets of experimental data, extracting key findings to guide research directions and innovation.
Operational Efficiency Analytics: Create analytical models to extract insights from operational data, uncovering bottlenecks and opportunities for process improvements.
Competitive Analysis Charts: Develop dynamic charts using Python to analyze competitors’ market presence, customer reviews, and social media sentiment, providing actionable insights for strategic positioning.
User Behavior Analysis: Utilize Python to mine user interaction data, identifying patterns and insights that inform user-centric product development and feature enhancement.
Customer Journey Mapping: Leverage data analytics to visualize the customer journey from initial engagement to purchase, pinpointing key touchpoints for optimization.
Resource Utilization Visualizations: Analyze project data to create visual representations of resource allocation and utilization, aiding in project planning and execution.
Market Trend Visualization: Extract insights from sales data to visualize market trends and performance metrics, guiding sales strategy and forecasting.
Workforce Analytics: Apply Python to analyze employee data, visualizing workforce demographics, performance, and engagement to support HR initiatives
Patient Data Visualizations: Use Python to visualize patient health trends and treatment outcomes, providing insights for medical staff and supporting patient care decisions.
Educational Outcome Analysis: Analyze academic data to visualize student performance trends, program effectiveness, and to develop data-driven educational strategies.
Financial Performance Charts: Craft interactive financial charts that provide real-time insights into financial metrics, investment performance, and market conditions.
Business Performance Analysis: Utilize Python to analyze client business data, extracting and visualizing insights that inform consultancy recommendations.
Impact Visualization: Analyze and visualize data related to program outcomes and impact, enhancing reporting to stakeholders and guiding program development.
IT Operations Analytics: Use Python to collect and visualize IT operations data, identifying patterns in system performance and predicting future IT needs.
Audience Engagement Insights: Analyze social media and website data to extract insights into audience preferences and engagement, informing content creation and marketing strategies.
Goals
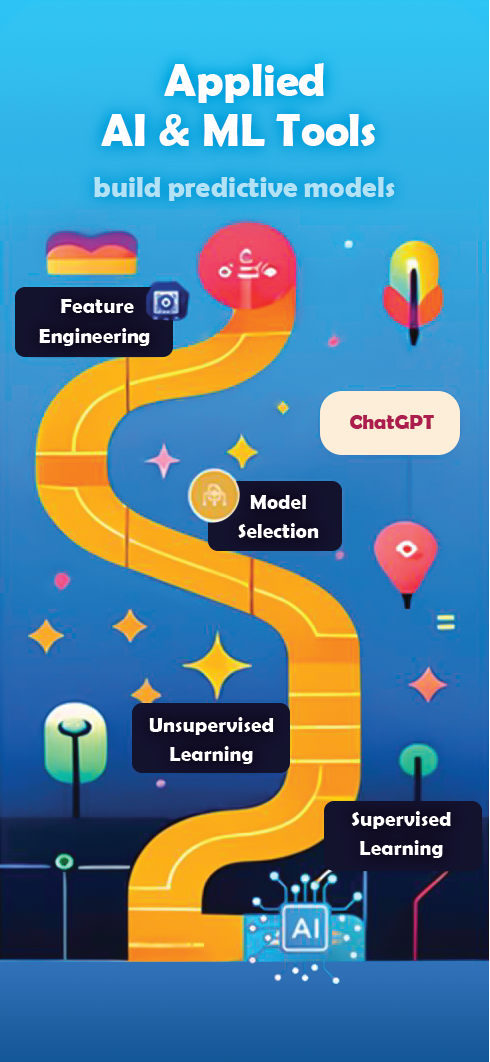
Acquire fundamental knowledge of data modeling and artificial intelligence, and utilize the various tools, libraries, and platforms offered in the market to create data models.
Module 1: Supervised Learning/Regression
- Understanding hypothesis, cost function, and training
- Coding linear regression from scratch to comprehend gradient descent
- Go beyond Linear Regression with Polynomial Regression
- Evaluating regression models using distribution of residuals
Module 2: Supervised Learning/Classification
- Linear Classification with logistic regression and single layer perceptron
- Nonlinear classification with multi layer perceptron
- Implementing classification models on imbalanced datasets
- Grid search for hyper paramter tuning
Module 3: Unsupervised Learning
- Understanding Fundamentals of Clustering
- K-Means Clustering, distance measures and Silhouette Coefficient
- Self Organizing Map(SOM)
- Clustering Case study on image color quantization
Module 4: Feature Transformation
- Linear Feature Transformation; Principle Component Analysis
- Non-linear feature transformation using Multi-layer perceptrons
- Pre-trained Deep Neural Networks
- Case study on CLIP; Connecting Text and Images
Module 5: Forming a roadmap
- Pre-processing
- Visualization and exploratory data analysis
- Model selection
- Unsupervised/supervised pipeline
Innovation Adoption Predictor: Leverage predictive models to estimate the rate of adoption for new technologies. Evaluate factors influencing adoption rates to guide development and go-to-market strategies
Sales Volume Prognostication: Create predictive models to forecast sales volumes. Integrate market trends, economic indicators, and internal sales data to plan for inventory and resource needs.
Market Entry Success Predictor: Use predictive models to assess the viability of new market entries. Analyze market data to forecast trends and consumer demand, helping to mitigate risks associated with launching new products or entering new markets.
Feature Success Prediction: Implement machine learning to predict the success of product features before launch. Analyze user feedback and beta testing data to prioritize which features will most likely resonate with the target market.
Campaign Outcome Forecaster: Develop models to predict the outcomes of marketing campaigns, allowing for the optimization of ad spend and content strategies. Use historical data to identify patterns that correlate with high engagement and conversion rates.
Project Success Modeling: Build models that can predict project success based on timelines, resource allocation, and team performance metrics, helping in making proactive adjustments to ensure project success.
Lead Conversion Predictor: Use AI to score sales leads based on their likelihood to convert, allowing sales teams to focus efforts on the most promising prospects.
Employee Turnover Prediction: Predict employee turnover by analyzing engagement scores, job satisfaction levels, and external market conditions, aiding in retention strategies.
Patient Readmission Likelihood Models: Predict patient readmissions using machine learning, based on clinical data, to improve patient outcomes and reduce costs associated with readmissions.
Student Performance Predictors: Create models to predict student academic performance, identifying at-risk students early and personalizing intervention strategies.
Investment Risk Analysis Models: Develop predictive models that assess the risk profile of various investment opportunities, allowing for smarter, data-informed investment decisions.
Business Risk and Opportunity Models: Build models for clients to predict business risks and uncover new opportunities by analyzing industry trends, economic signals, and internal business metrics.
Fundraising Success Predictors: Predict the success of fundraising campaigns and identify factors that influence donor behavior, optimizing outreach efforts and resource allocation.
Cyber Threat Prediction Systems: Use machine learning to predict potential cybersecurity threats, enabling proactive defense measures and resource planning for threat response.
Trend Forecasting for Creative Content: Implement predictive analytics to forecast design and content trends, helping to keep creative projects ahead of the curve and aligned with consumer interests.

Dr. Mehdi Norouzi
Associate Professor-Educator
University of Cincinnati, US
Meet Your Instructor: Dr. Mehdi Norouzi
Dr. Mehdi Norouzi, an esteemed Associate Professor-Educator in Electrical Engineering and Computer Science at the University of Cincinnati, US, brings a wealth of expertise to our “Coding for No-Coders” workshops. With a rich background in machine learning and signal processing, Dr. Norouzi specializes in the practical application of sequence modeling. His innovative research includes projects like aerial data analysis using UAVs, early stroke detection, and structural health monitoring systems.
His courses, especially tailored for non-computer science majors, have been lauded for their accessibility and relevance, consistently receiving high ratings from students. Dr. Norouzi’s dedication to education has been recognized through multiple awards, including the Eta Kappa Nu Outstanding Professor Award, the William E. Restemeyer Teaching Excellence Award, and PEC Teacher of the year Award from National Taipei University of Technology.
Join Dr. Norouzi in our workshop series where he combines academic rigor with real-world applications, guiding professionals to master data analytics and AI, and equipping them with skills to thrive in today’s tech-driven landscape.
Data Mastery & AI Toolkit: The Complete Python & ML Course Bundle
SEK 25,000
SEK 30,000
• 10 Workshops (10 x 4 hours)
Embark on an all-encompassing journey into the realms of data and artificial intelligence with our Integrated Python & AI Essentials Bundle. This package offers a seamless progression from mastering data analytics in Python to applying machine learning tools in real-world scenarios. Propel your career forward with this dual-course bundle that equips you with critical skills for the future of tech.
Features:
• A curated curriculum blending Python for Data Analytics and Applied AI & ML Tools
• A total of 10 workshops designed to build one upon the other for a cohesive learning experience
• Specialized knowledge from data extraction to machine learning model deployment
• Exclusive access to advanced analytical tools and AI algorithms
• Cost-effective pricing for a comprehensive education package
Python for Data Analytics
SEK 15,000
• 5 Workshops (5 x 4 hours)
Dive into the heart of data analytics with our Python for Data Analytics course. Designed for professionals seeking to harness the power of data, this course guides you through Python fundamentals, data manipulation, and visualization techniques. Transform raw data into insightful decisions, and emerge with the confidence to tackle complex data challenges in your industry.
Features:
• Comprehensive introduction to Python programming
• Hands-on experience with data manipulation using Pandas
• Mastery of data visualization with Matplotlib and Plotly
• Real-world case studies and practical exercises
• Interactive sessions for enhanced learning
Applied Artificial Intelligence and Machine Learning Tools
SEK 15,000
• 5 Workshops (5 x 4 hours)
Elevate your expertise with our Applied AI & ML Tools course. Tailored for ambitious professionals, this course provides an in-depth exploration of the latest AI and machine learning technologies. Learn to build, train, and deploy predictive models that make an impact. With our expert-led modules, unlock the potential of AI to innovate and drive success in your domain.
Features:
• Fundamental concepts of machine learning and deep learning
• Practical skills in supervised and unsupervised learning
• Techniques for feature transformation and model optimization
• Cutting-edge case studies
• Collaborative project work for hands-on application
